링크에서 조금만 바꿨음
x라벨 위치값 찾았으니까 툴팁도 나오게 할 수 있을 것 같아서 바꿔 봄
html
<div class="chartBox">
<div class="x_label_tooltip"></div>
<canvas id="myChart"></canvas>
</div>
css
.chartBox {
width: 700px;
position: relative;
border-radius: 20px;
border: solid 3px rgba(54, 162, 235, 1);
background: white;
}
.x_label_tooltip {
display: none;
position: absolute;
bottom: -20px;
background:#fff;
border: 1px solid red;
}
.x_label_tooltip.active {
display: block;
}
const data = {
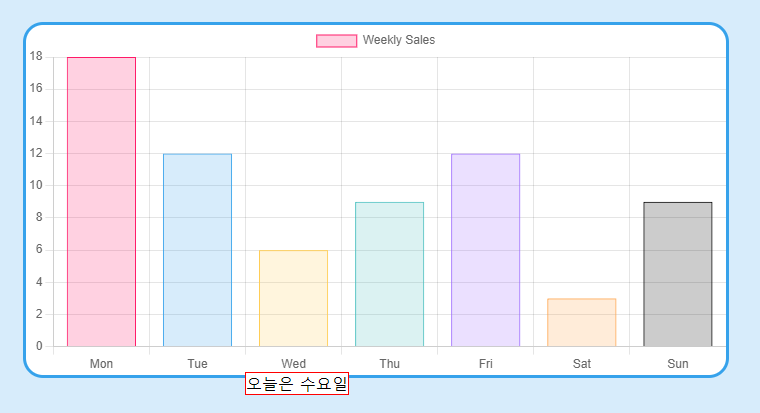
labels: ['Mon', 'Tue', 'Wed', 'Thu', 'Fri', 'Sat', 'Sun'],
labelsTooltip: [
'오늘은 월요일',
'오늘은 화요일',
'오늘은 수요일',
'오늘은 목요일',
'오늘은 금요일',
'오늘은 토요일',
'오늘은 일요일',
],
datasets: [{
label: 'Weekly Sales',
data: [18, 12, 6, 9, 12, 3, 9],
backgroundColor: [
'rgba(255, 26, 104, 0.2)',
'rgba(54, 162, 235, 0.2)',
'rgba(255, 206, 86, 0.2)',
'rgba(75, 192, 192, 0.2)',
'rgba(153, 102, 255, 0.2)',
'rgba(255, 159, 64, 0.2)',
'rgba(0, 0, 0, 0.2)'
],
borderColor: [
'rgba(255, 26, 104, 1)',
'rgba(54, 162, 235, 1)',
'rgba(255, 206, 86, 1)',
'rgba(75, 192, 192, 1)',
'rgba(153, 102, 255, 1)',
'rgba(255, 159, 64, 1)',
'rgba(0, 0, 0, 1)'
],
borderWidth: 1
}]
};
// config
const config = {
type: 'bar',
data,
options: {
scales: {
y: {
beginAtZero: true
}
}
}
};
// render init block
const ctx = document.getElementById('myChart');
const myChart = new Chart(
ctx,
config
);
function clickableScales(canvas, click){
//x라벨 위치 찾기
const height = myChart.scales.x.height;
const top = myChart.scales.x.top;
const bottom = myChart.scales.x.bottom;
const left = myChart.scales.x.left;
const right = myChart.scales.x.maxWidth / myChart.scales.x.ticks.length;
let resetCoordinates = canvas.getBoundingClientRect();
const x = click.clientX - resetCoordinates.left;
const y = click.clientY - resetCoordinates.top;
//x라벨 위치값 반복문으로 설정
for(let i = 0; i < myChart.scales.x.ticks.length; i++) {
if(x >= left + (right * i) && x <= right + (right * i) && y >= top && y <= bottom) {
const tooltipData = data.labelsTooltip[i];
// x_label_tooltip 업데이트
const tooltipElement = document.querySelector('.x_label_tooltip');
tooltipElement.textContent = tooltipData;
//툴팁 위치
tooltipElement.style.left = `${left + (right * i)}px`;
tooltipElement.classList.add('active');
}
}
}
ctx.addEventListener('click', (e) => {
clickableScales(ctx, e)
//차트 크기가 변경되면 오류가 나니까 추가
myChart.resize();
// myChart.update();
})
'언어 > Chart.js' 카테고리의 다른 글
| [chart.js] 분산형 그래프 포인트를 이미지로 (0) | 2024.03.16 |
|---|---|
| [chart.js] 라인차트 데이터가 있는 곳만 표시하기 (0) | 2024.03.12 |
| [chart.js] 그래프 hover시 마우스 포인터(v.4.2.1) (1) | 2024.03.06 |
| [Chart.js] 그래프 클릭하면 모달 창 띄우기(v.4.2.1) (0) | 2024.01.18 |
| [Chart.js]x라벨 클릭하면 링크로 이동하기(v4.2.1) (0) | 2024.01.16 |