html
<div class="chartMenu">
<p>WWW.CHARTJS3.COM (Chart JS <span id="chartVersion"></span>)</p>
</div>
<div class="chartCard">
<div class="chartBox">
<canvas id="myChart"></canvas>
</div>
</div>
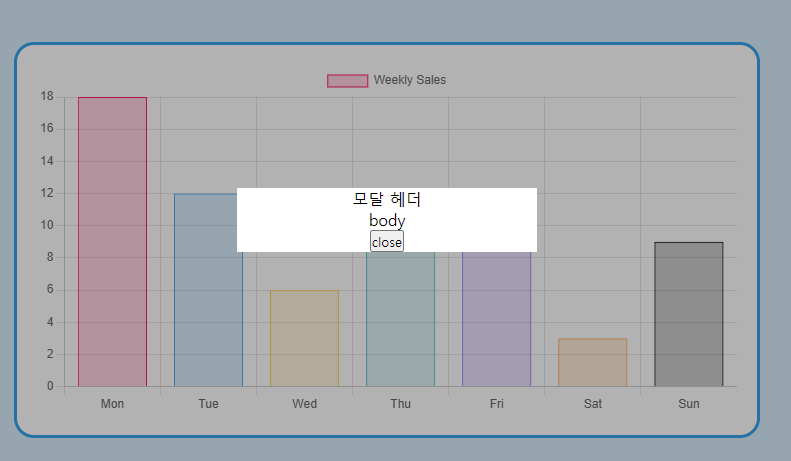
<div id="barModal" class="bar_modal">
<div class="modal">
<div class="modal_header">
모달 헤더
</div>
<div class="modal_body">
body
</div>
<button onclick="modalClose()">close</button>
</div>
</div>
css
.bar_modal {
            z-index: 10;
            position: fixed;
            margin: 0;
            padding: 0;
            left: 0;
            top: 0;
            height: 100vh;
            width: 100%;
            background: rgba(0,0,0,0.3);
            transition: opacity .2s;
        }
        .bar_modal.hide {
            opacity: 0;
            z-index: -10;
        }
        .modal {
            background: #fff;
            width: 300px;
            position: absolute;
            top: 50%;
            left: 50%;
            transform: translate(-50%, -50%);
            text-align: center;
        }
차트 옵션
const data = {
            labels: ['Mon', 'Tue', 'Wed', 'Thu', 'Fri', 'Sat', 'Sun'],
            datasets: [{
                label: 'Weekly Sales',
                data: [18, 12, 6, 9, 12, 3, 9],
                backgroundColor: [
                'rgba(255, 26, 104, 0.2)',
                'rgba(54, 162, 235, 0.2)',
                'rgba(255, 206, 86, 0.2)',
                'rgba(75, 192, 192, 0.2)',
                'rgba(153, 102, 255, 0.2)',
                'rgba(255, 159, 64, 0.2)',
                'rgba(0, 0, 0, 0.2)'
                ],
                borderColor: [
                'rgba(255, 26, 104, 1)',
                'rgba(54, 162, 235, 1)',
                'rgba(255, 206, 86, 1)',
                'rgba(75, 192, 192, 1)',
                'rgba(153, 102, 255, 1)',
                'rgba(255, 159, 64, 1)',
                'rgba(0, 0, 0, 1)'
                ],
                borderWidth: 1
            }]
        };

        // config
        const config = {
        type: 'bar',
        data,
        options: {
            scales: {
            y: {
                beginAtZero: true
            }
            }
        }
        };

        // render init block
        const ctx = document.getElementById('myChart');
        const myChart = new Chart(
            ctx,
            config
        );
        const barModal = document.getElementById('barModal');

        function modalClose() {
            barModal.classList.add('hide')
        }
        function modalOpen(click) {
            const points = myChart.getElementsAtEventForMode(click, 'nearest', {
                intersect: true}, true);

            if(points[0]) {
                const dataset = points[0].datasetIndex;
                const datapoint = points[0].index;
                barModal.classList.remove('hide')
            }
        }

        ctx.onclick = modalOpen;
###########추가
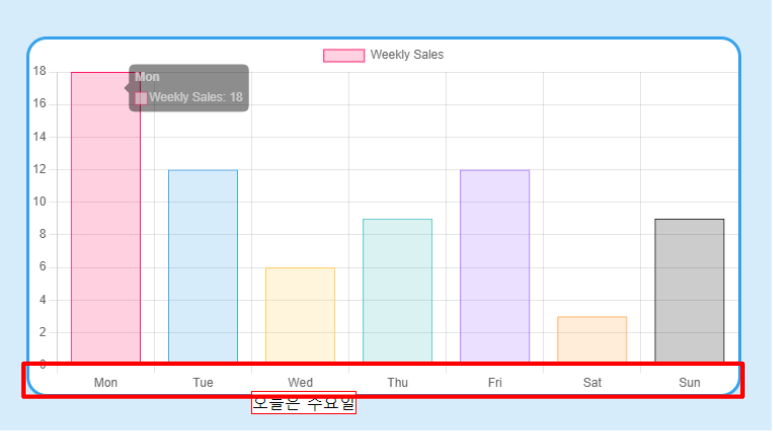
빨간 박스 밖을 누르면 툴팁 사라지게 변경
function clickableScales(canvas, click){
            //x라벨 위치 찾기
            const height = myChart.scales.x.height;
            const top = myChart.scales.x.top;
            const bottom = myChart.scales.x.bottom;
            const left = myChart.scales.x.left;
            const right = myChart.scales.x.maxWidth / myChart.scales.x.ticks.length;

            let resetCoordinates = canvas.getBoundingClientRect();
            const x = click.clientX - resetCoordinates.left;
            const y = click.clientY - resetCoordinates.top;

            //x라벨 위치값 반복문으로 설정
            const tooltipElement = document.querySelector('.x_label_tooltip');
            for(let i = 0; i < myChart.scales.x.ticks.length; i++) {
                if(x >= left + (right * i) && x <= right + (right * i) && y >= top && y <= bottom) {
                    const tooltipData = data.labelsTooltip[i];

                    // x_label_tooltip 업데이트
                    tooltipElement.textContent = tooltipData;

                    //툴팁 위치
                    tooltipElement.style.left = `${left + (right * i)}px`;

                    tooltipElement.classList.add('active');
                }

            }

//여기서부터 추가된부분
            function isTooltipOutside(element) {
                return element.closest('#myChart');
            }
            function clickHandler(e) {
                if (tooltipElement.classList.contains('active')) {
                    // active 클래스를 가진 툴팁에 대한 이벤트 처리
                    const isOutside = !isTooltipOutside(e.target);
                    const chartTop = myChart.canvas.getBoundingClientRect().top;
                    const relativeY = e.clientY - chartTop;
                    const xArea = myChart.canvas.height - myChart.scales.x.height;

                    if (relativeY < xArea || isOutside) {
                        tooltipElement.classList.remove('active');
                    }
                }
            }

            // 한 번만 이벤트 리스너 추가
            document.addEventListener('click', clickHandler);
        }
차트 캔버스 밖을 클릭하거나 x라벤 영역을 제외한 차트영역을 클릭하면 툴팁 사라짐
############
x라벨 제외한 구역이랑 모달 영역 밖과 교차된 구역만 클릭하도록 변경
function clickHandler(e) {
    if (tooltipElement.classList.contains('active')) {
        // active 클래스를 가진 툴팁에 대한 이벤트 처리
        const isOutside = e.target.parentElement.classList.contains('x_label_tooltip');
        const chartTop = myChart.canvas.getBoundingClientRect().top;
        const relativeY = e.clientY - chartTop;
        const xArea = myChart.canvas.height - myChart.scales.x.height;
        const XlabelOutside = relativeY < xArea || relativeY > myChart.canvas.height;

        console.log(`${XlabelOutside} ${!isOutside}`);

        if (XlabelOutside && !isOutside) {
            tooltipElement.classList.remove('active');
        }
    }
}'언어 > Chart.js' 카테고리의 다른 글
| [chart.js] 분산형 그래프 포인트를 이미지로 (0) | 2024.03.16 |
|---|---|
| [chart.js] 라인차트 데이터가 있는 곳만 표시하기 (0) | 2024.03.12 |
| [chart.js] 그래프 hover시 마우스 포인터(v.4.2.1) (1) | 2024.03.06 |
| [Chart.js]x라벨 클릭하면 툴팁 나오게 하기(v4.2.1) (0) | 2024.01.16 |
| [Chart.js]x라벨 클릭하면 링크로 이동하기(v4.2.1) (0) | 2024.01.16 |